USD/CAD Price Analysis: Extends bounce off 50-day EMA towards 1.2800
- USD/CAD renews intraday high, keeps corrective pullback from 13-day low.
- Bearish MACD signals, steady RSI favor sellers until staying below 1.2920.
- Key Fibonacci retracement levels add to the downside filters
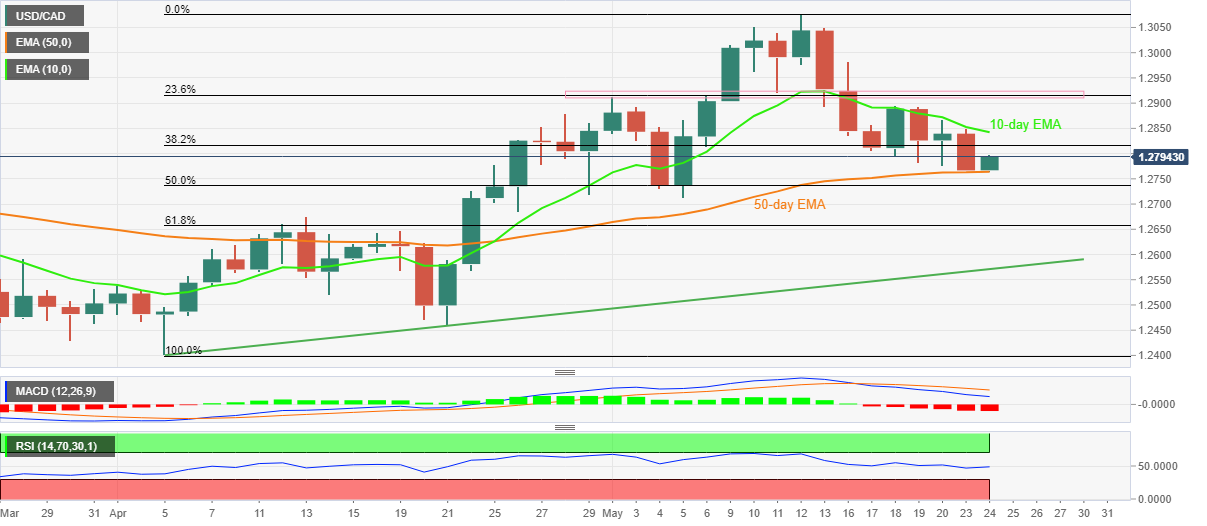
USD/CAD picks up bids to renew daily top surrounding 1.2800, after the biggest daily fall towards testing a fortnight low. In doing so, the Loonie pair rebounds from the 50-day EMA during Tuesday’s Asian session.
Even so, bearish MACD signals and the steady RSI keeps USD/CAD bulls worried. Also challenging the recovery moves is the 10-day EMA level surrounding 1.2845.
Additionally, a three-week-long horizontal area comprising the 23.6% Fibonacci retracement (Fibo.) of April-May upside, as well as the tops marked during early May, will also challenge the pair’s short-term upside near 1.2920.
In a case where USD/CAD rises past 1.2920, the 1.3000 threshold and the monthly peak of 1.3076 will be on the bull’s radar.
On the contrary, a daily closing below the 50-day EMA level of 1.2764 can direct USD/CAD sellers towards the 50% and 61.8% Fibonacci retracements, respectively near 1.2740 and 1.2660.
Following that, a south-run towards the late April swing low near 1.2460 can’t be ruled out.
USD/CAD: Daily chart
Trend: Further weakness expected