WTI Price Analysis: Bulls cross 100-SMA to renew one-week high around $106.50
- WTI extends rebound from monthly low, up for the fourth consecutive day.
- An upside break of weekly resistance line, 200-SMA join bullish MACD signals to favor buyers.
- 61.8% Fibonacci retracement level adds to the downside filters.
WTI remains on the front foot around $106.30, up nearly 3.0% on a day after refreshing weekly tops around $106.70 during Monday’s late Asian session.
Although the black gold retreats from daily top of late, also the weekly high, it manages to stay beyond the 100 and 200 SMAs, as well as a downward sloping trend line from March 10.
Given the bullish MACD signals favor the latest breakouts, the upside momentum is likely to extend.
However, a clear break of the 50% Fibonacci retracement level of February 18 to March 08 upside, near $107.00, becomes necessary for the bull’s conviction.
Following that, a fortnight-long horizontal area surrounding $115.00 will regain the market’s attention.
Alternatively, pullback moves may initially aim for the 100-SMA and the previous resistance line, respectively around $105.30 and $104.00, before highlighting the 61.8% Fibonacci retracement level surrounding $102.30.
In a case where the WTI crude oil prices drop below $102.30, the odds of witnessing a south-run towards the $100.00 threshold and then to the 200-SMA near $98.00 can’t be ruled out.
WTI: Four-hour chart
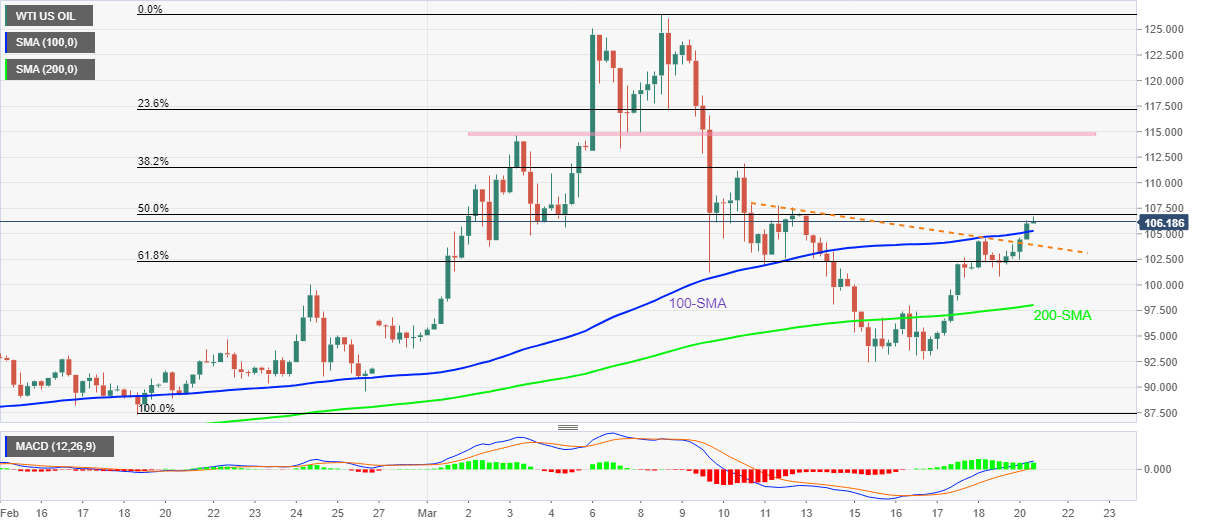
Trend: Further upside expected