USD/CAD Price Analysis: Recovery remains capped around 1.2600
- USD/CAD grinds higher around intraday top, challenges the bears after three-day fall.
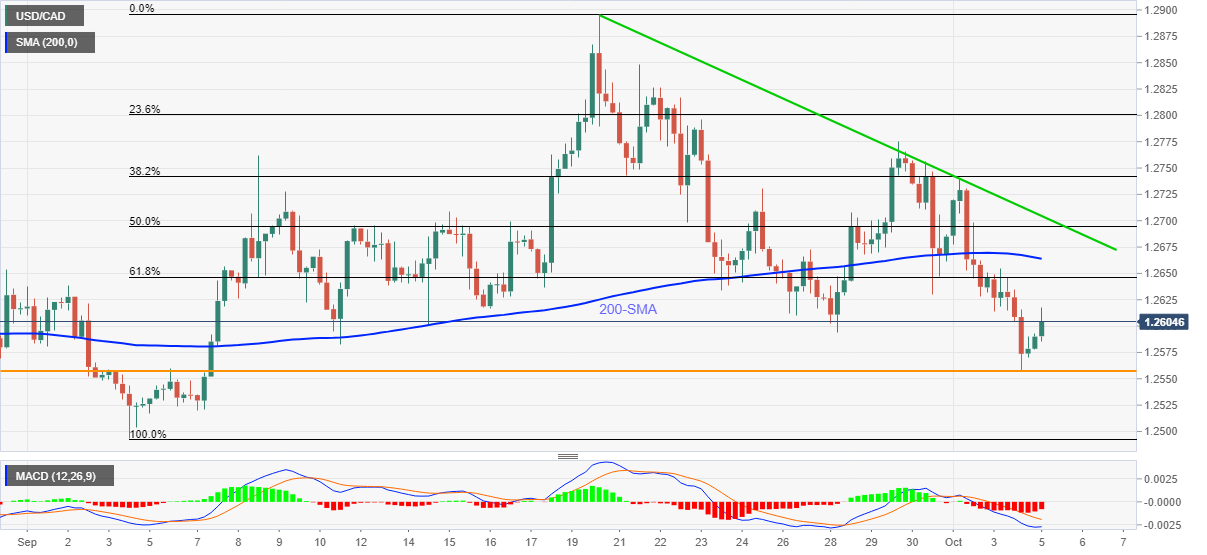
- Bearish MACD, sustained trading below the key Fibonacci retracement levels, SMA hints at underlying weakness.
- Monthly horizontal support guards immediate downside, fortnight-long descending trend line adds to the upside filters.
USD/CAD defends the 1.2600 threshold while snapping a three-day downtrend during early Tuesday.
In doing so, the quote keeps rebound from a one-month-long horizontal area but remains below the key Fibonacci retracement (Fibo.) levels of early September advances amid bearish MACD signals.
Hence, the corrective pullback may remain less interesting until staying below 61.8% Fibo. level around 1.2650.
Also acting as upside barriers is the 200-SMA and a descending resistance line from September 20, respectively near 1.2665 and 1.2705.
In a case where USD/CAD bulls manage to pierce the 1.2705 hurdle, the late September swing high close to 1.2775 will be in focus.
Alternatively, pullback moves may aim for the monthly horizontal support retest, near 1.2555, a break of which will direct the USD/CAD sellers towards the last monthly bottom of 1.2493.
During the quote’s weakness past 1.2493, July’s low surrounding 1.2420 will be crucial to follow.
USD/CAD: Four-hour chart
Trend: Further weakness expected