Back
21 Apr 2020
USD/JPY Price Analysis: Greenback sidelined below 108.00 figure vs. Japanese yen
- USD/JPY is trading mixed on the second day of the trading week.
- The level to beat for sellers is the 107.00 support.
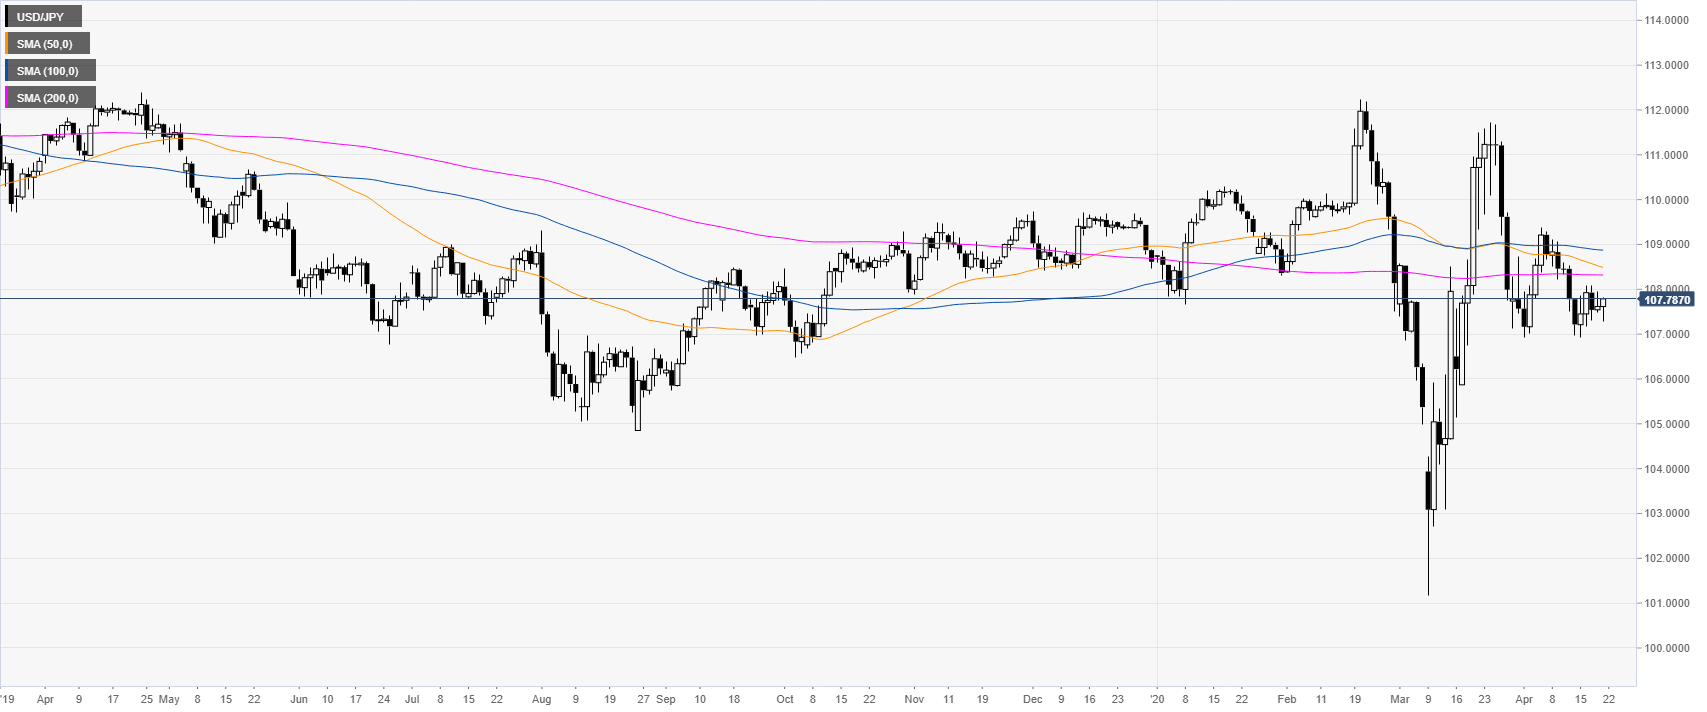
USD/JPY daily chart
USD/JPY is trading below the main SMAs (simple moving averages) on the daily chart as the quote is trapped in familiar ranges.
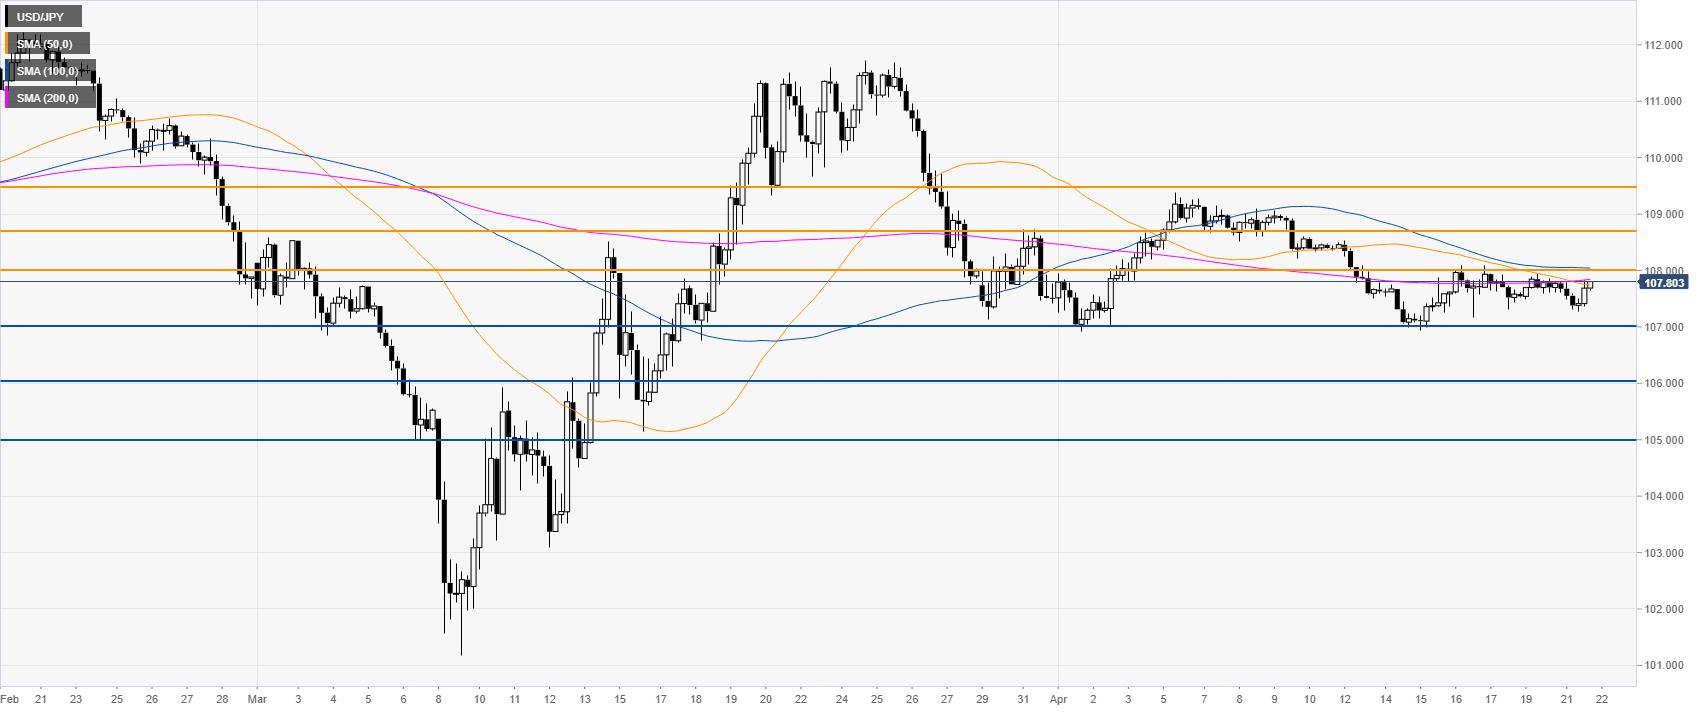
USD/JPY four-hour chart
USD/JPY is trading below the 50 and 100 SMAs on the four-hour chart suggesting a negative bias in the medium term. The spot is sidelined below the 108.00 figure unable to find a clear direction. The level to beat for bears is the 107.00 support while 108.00 can act as resistance.
Additional key levels