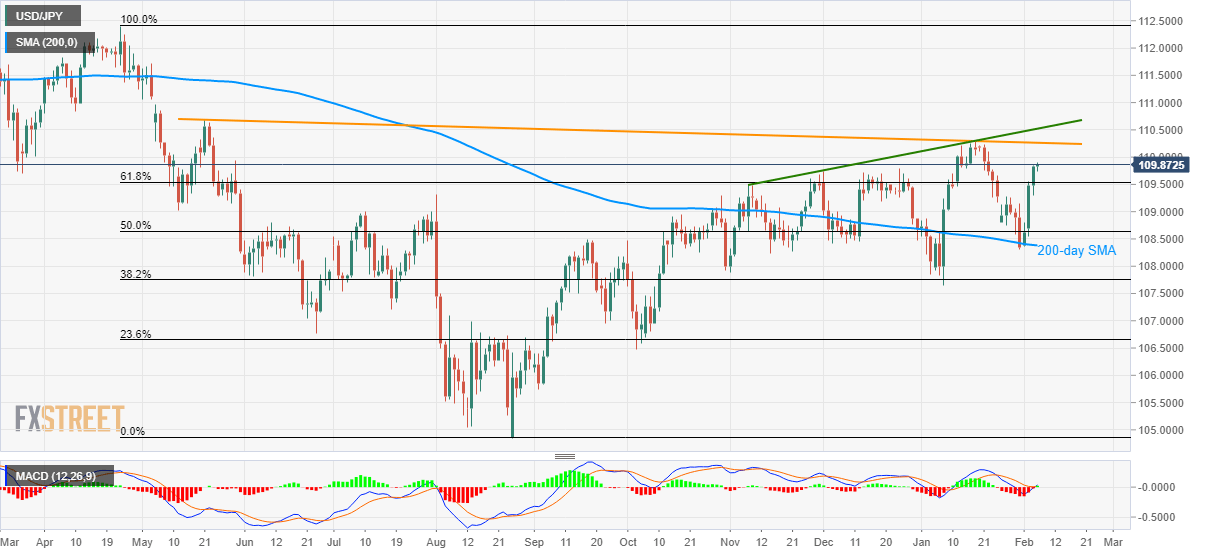
USD/JPY Price Analysis: Refreshes two-week high above 61.8% Fibonacci
- USD/JPY holds onto recovery gains from 200-day SMA.
- A descending trend line from May, an upward sloping resistance line since November in focus.
- Sustained break of the key Fibonacci level, bullish MACD favor further upside.
USD/JPY extends the four-day-old winning streak to 109.90 during early Thursday. The pair stays on the front foot after clearing 61.8% Fibonacci retracement of its April-August 2019 fall whereas bullish MACD signal portrays the strength of upside momentum.
While 110.00 round-figure could offer immediate resistance to the pair, a falling trend line since May 21, 2019, near 110.25, gains the major attention of buyers.
Additionally, the pair’s upward trajectory beyond 110.25 could aim for a rising trend line that connects the tops marked in the last three months, at 110.55.
On the flip side, sellers will refrain from entry unless prices slip below 109.53, comprising 61.8% Fibonacci retracement, on a daily closing basis.
Even so, 50% Fibonacci retracement and 200-day SMA, around 108.65 and 108.38, can keep further declines questionable.
USD/JPY daily chart

Trend: Bullish
