Back
3 Feb 2020
Gold Price Analysis: XAU/USD bull-run exhausted in the medium term
- The market keeps reluctantly advancing in a bear flag formation.
- The level to beat for bears is the 1570 support.
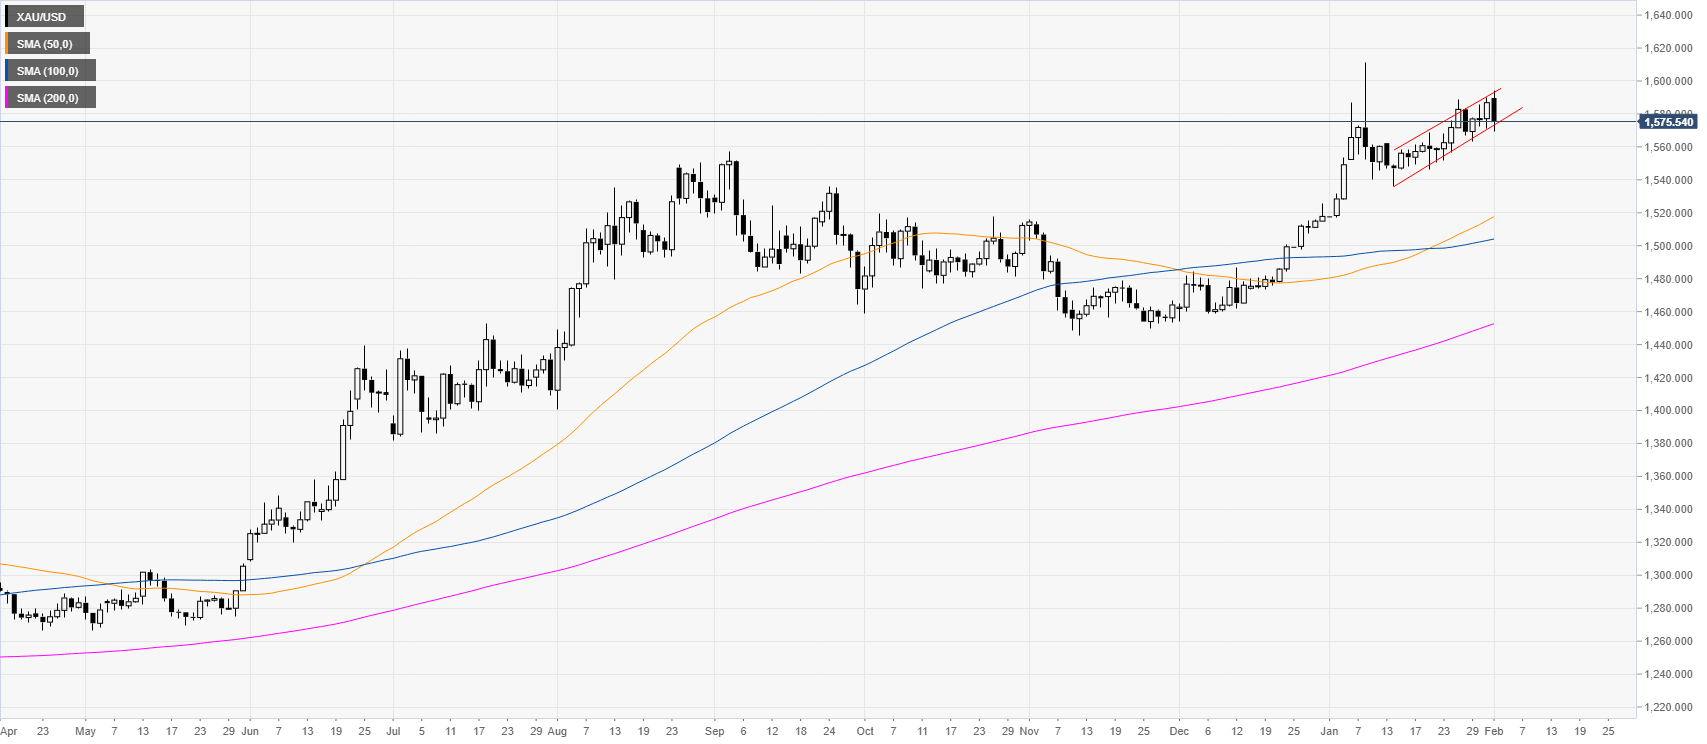
Gold daily chart
XAU/USD is trading in a bull trend above the main daily simple moving averages (SMAs). After fading the 1600 mark earlier in January, the metal has been trading in a bear flag in the second part of January.
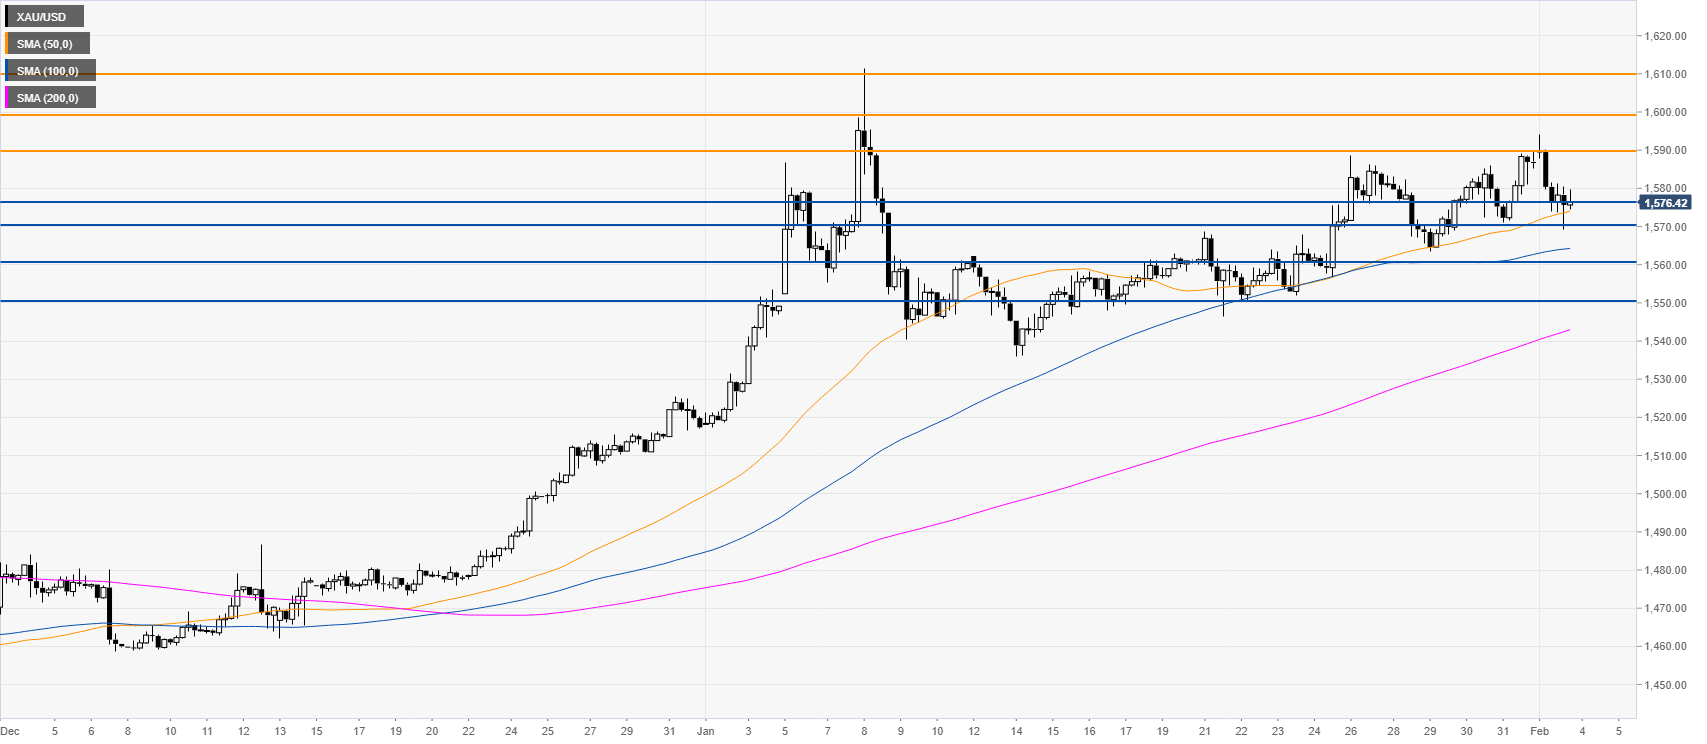
Gold four-hour chart
The market is still trading above the main SMAs on the four-hour chart. However, the market more likely formed a double top/lower low with the high established at the start of January. If bears breach the 1576/70 support zone, the market is most likely to lose more steam towards the 1556 and 1550 price levels in the medium term. Resistances are seen near 1590, 1600 and 1610 price levels.
Additional key levels