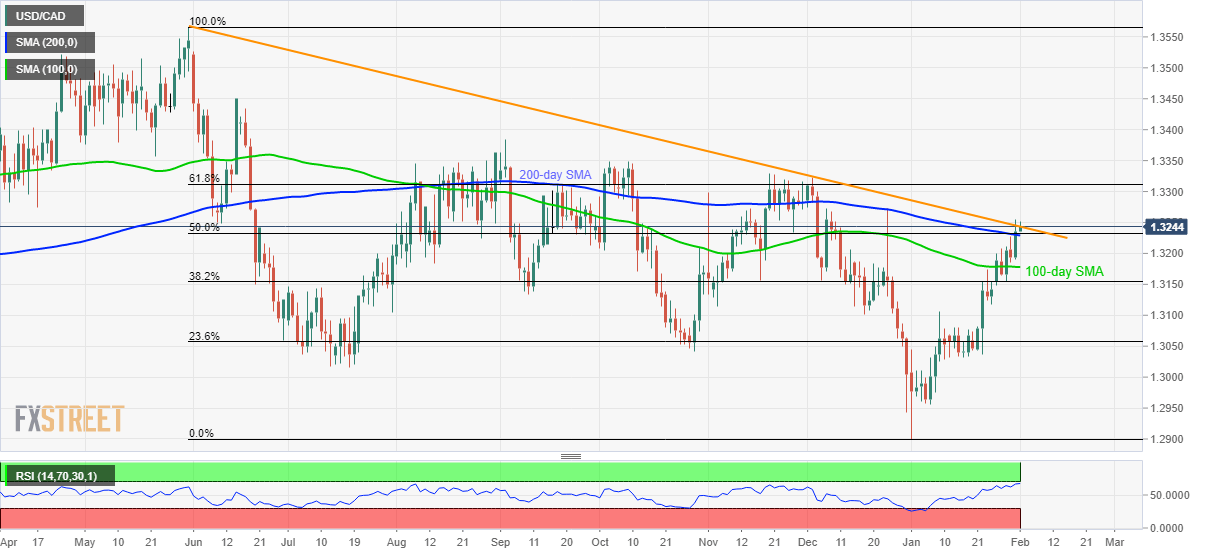
USD/CAD Price Analysis: Positive beyond 200-day SMA, 50% Fibonacci
- USD/CAD pierces an eight-week-old falling resistance line.
- 61.8% Fibonacci retracement adds to the upside barriers.
- 100-day SMA could lure sellers during the pullback.
USD/CAD trades modestly positive around 1.3245 ahead of the European session on Monday. In doing so, the quote seesaws near the strongest in 2020 while also challenges a downward sloping trend line since May 31, 2019. However, RSI conditions are nearly overbought.
As a result, the bulls will wait for entry on the daily closing beyond the 1.3245 resistance line. With that, 61.8% Fibonacci retracement of the pair’s declines from May 2019 to January 2020, at 1.3315, will be on the buyer’s radar.
In a case, the USD/CAD prices fail to close beyond 1.3245 on a daily closing basis, sellers will not cheer the performance as 200-day SMA and 50% Fibonacci retracement, near 1.3230, challenges the bears.
On the break of 1.3230, a 100-day SMA level of 1.3178 and 38.2% Fibonacci retracement near 1.3150 could please the sellers.
USD/CAD daily chart

Trend: Bullish
