GBP/JPY Technical Analysis: Bullish spinning top on D1, break of 21-day SMA favor buyers
- GBP/JPY holds onto recovery gains for the third day in a row.
- Prices above 21-day SMA, bullish candlestick formation highlight 50% Fibonacci retracement as nearby resistance.
- 61.8% Fibonacci retracement level adds to the support.
GBP/JPY takes the bids to 143.15 during Friday’s Asian session. In doing so, the pair keeps its latest break beyond 21-day SMA while trading around the one-week top. Also supporting the buyers is the bullish spinning top candlestick formation on the daily (D1) chart.
Hence, the quote is likely to extend its recovery towards 50% Fibonacci retracement of late-November bottoms to December month top, around 143.65.
During the pair’s further upside, 144.35/40 and 23.6% Fibonacci retracement level of 145.90 can entertain the Bulls.
On the contrary, 61.8% Fibonacci retracement of 142.60 can offer additional support, below a 21-day SMA level of 143.00.
Should sellers manage to smash 142.60, the weekly low near 140.84 and a seven-week-old rising trend line, at 140.67 now, will hold the key to 140.00 round-figure.
GBP/JPY daily chart
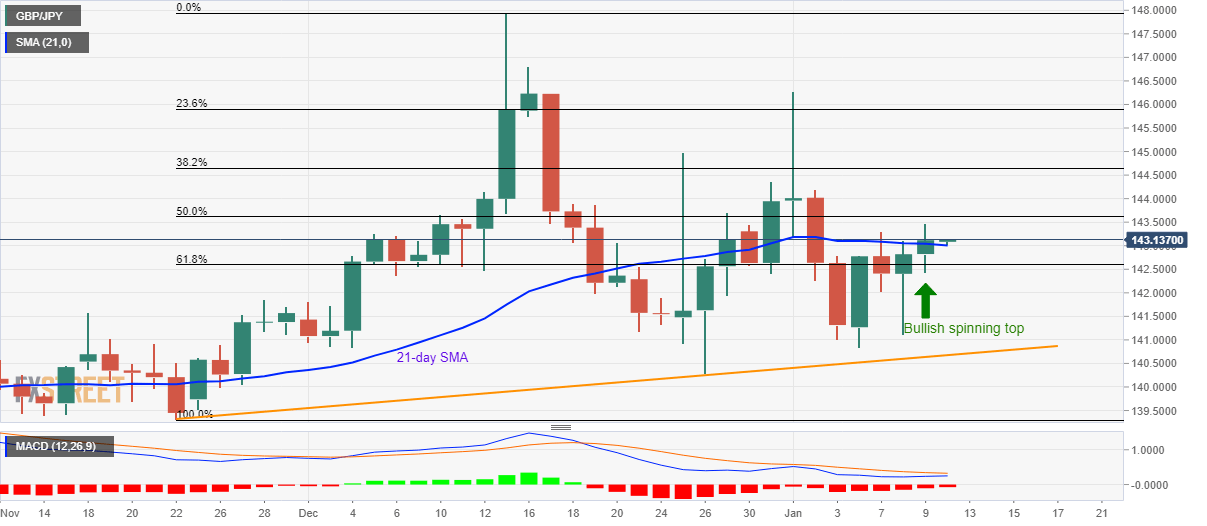
Trend: Bullish