Back
27 Nov 2019
US Dollar Index Technical Analysis: DXY climbs to 5-week highs, nearing 98.50 key resistance
- DXY is approaching the 98.50 key resistance
- The level to beat for buyers is the 98.50 price level.
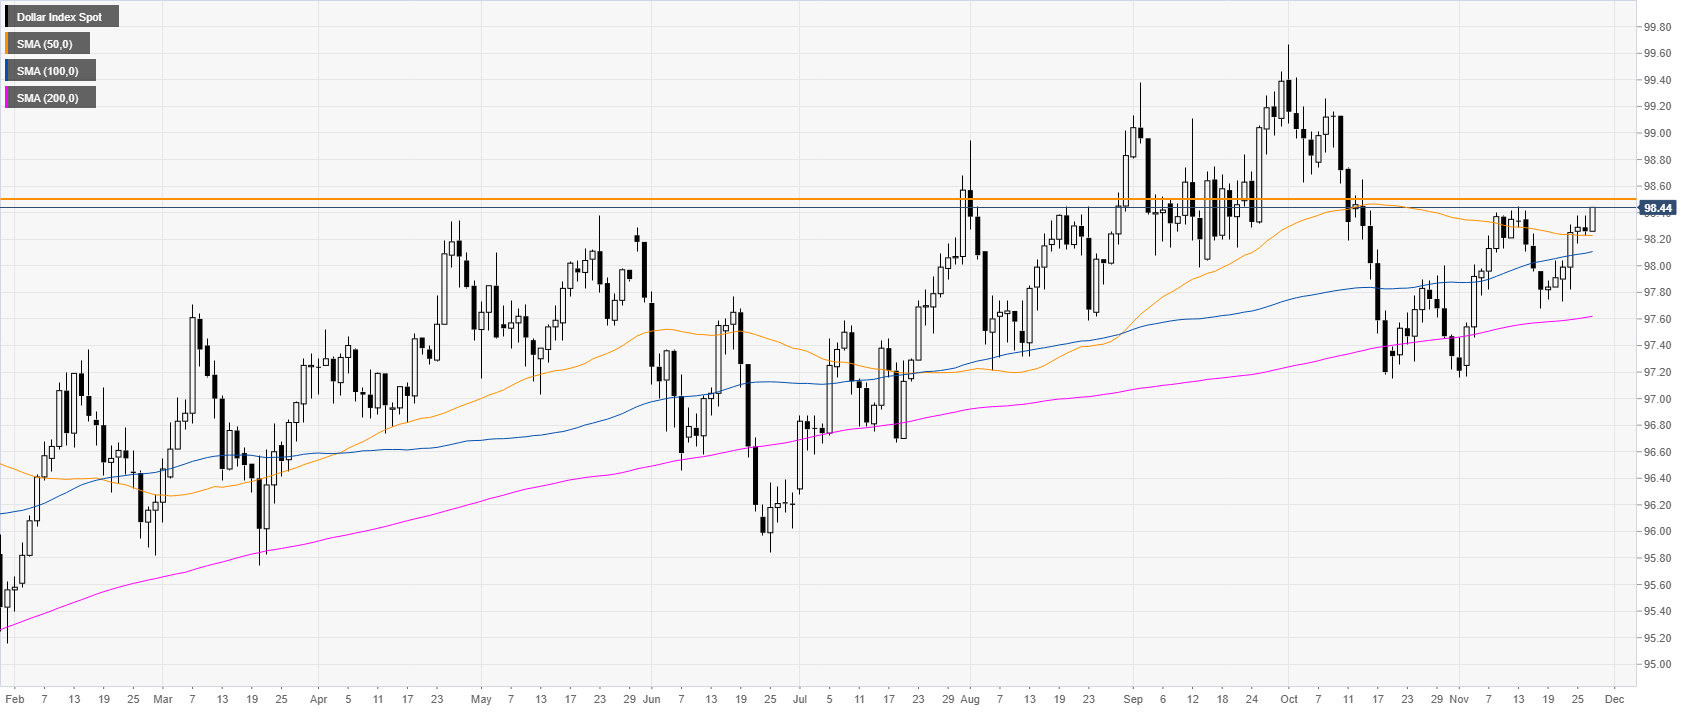
DXY daily chart
DXY (US Dollar Index) is trading in a bull trend above the main daily simple moving averages (DMAs). This Wednesday, DXY is gaining ground near a critical resistance at the 98.50 level.
In the US, the GDP expanded 2.1% in Q3 (second estimate) vs. 1.9% expected, strengthening the USD.
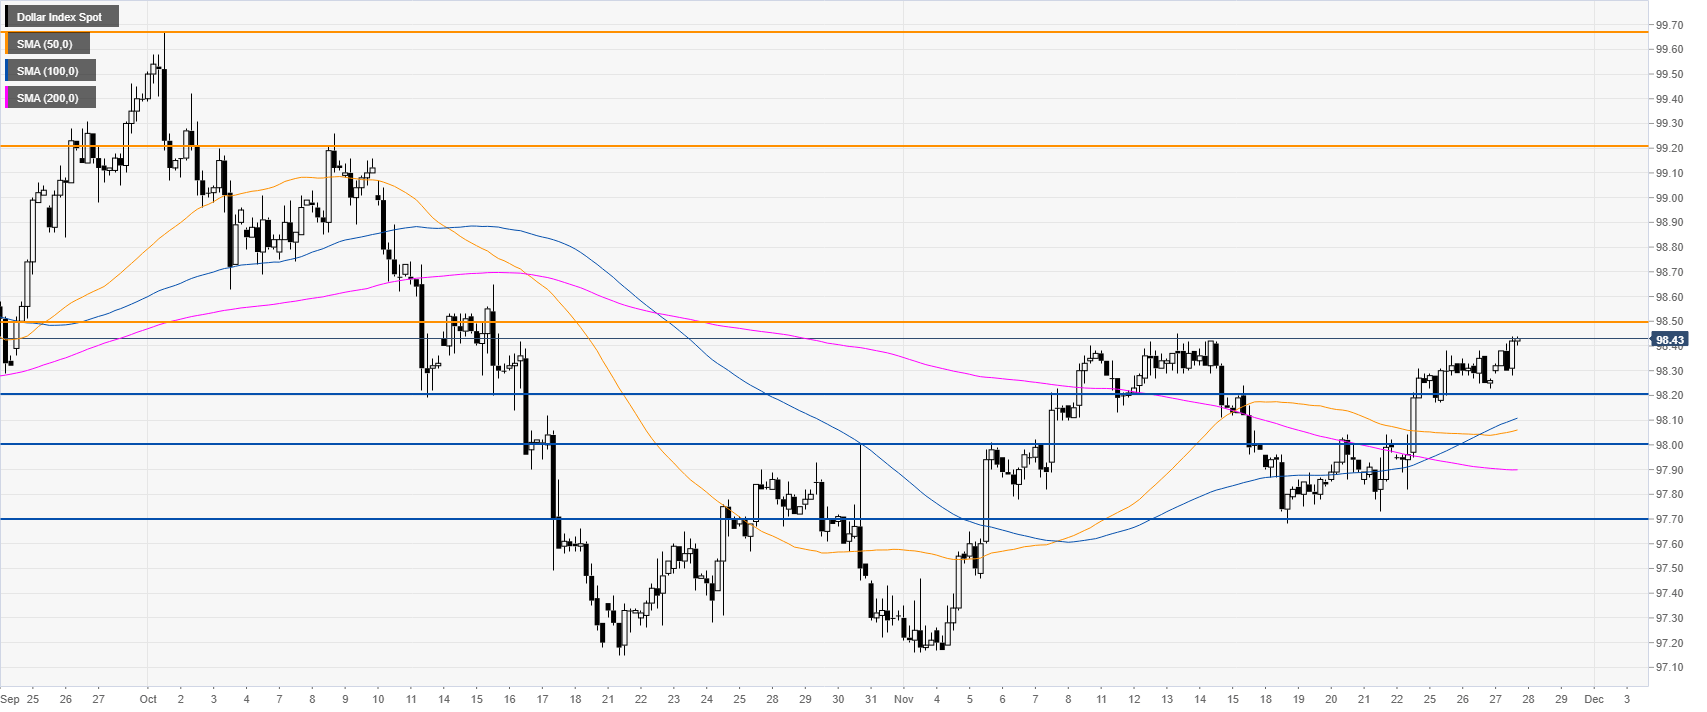
DXY 4-hour chart
DXY is trading above the main SMAs on the four-hour chart, suggesting a bullish momentum in the medium term. If the buyers can break the 98.50 level, the market could appreciate towards the 99.20 level and potentialy to the 99.67 level (2019 high).
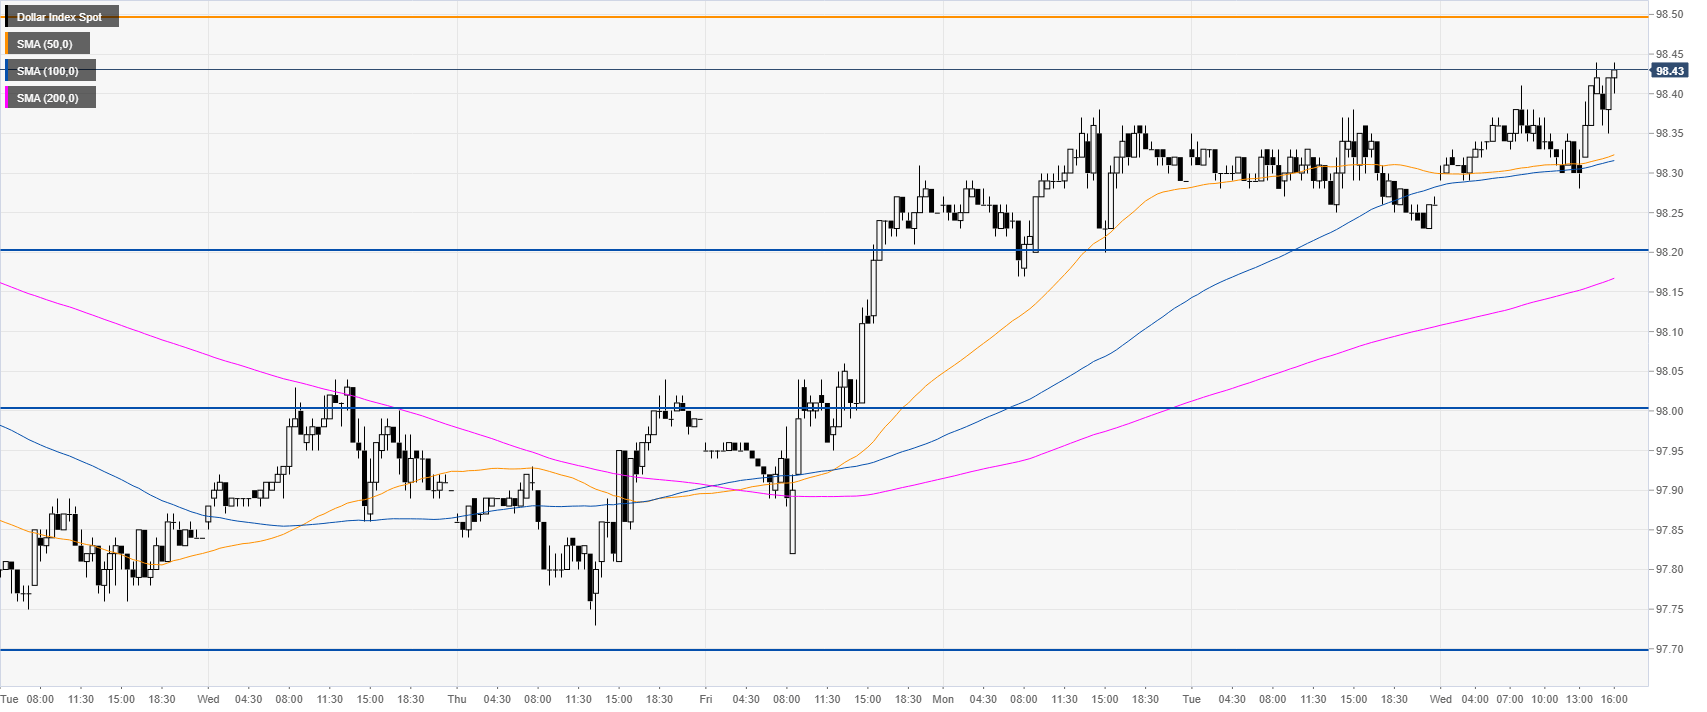
DXY 30-minute chart
The is climbing up above the main SMAs, suggesting bullish momentum in the near term. Support is seen at the 98.20 level. Further down, lies the 98.00 handle which can also act as support.
Additional key levels