Back
29 Oct 2019
EUR/USD technical analysis: Euro trading off daily highs, holding above 1.1100 figure
- The Euro is hovering near daily highs above the 1.1100 figure.
- Support is seen at the 1.1092 and 1.1069 price levels.
- The level to beat for bulls is the 1.1120 resistance in the near term.
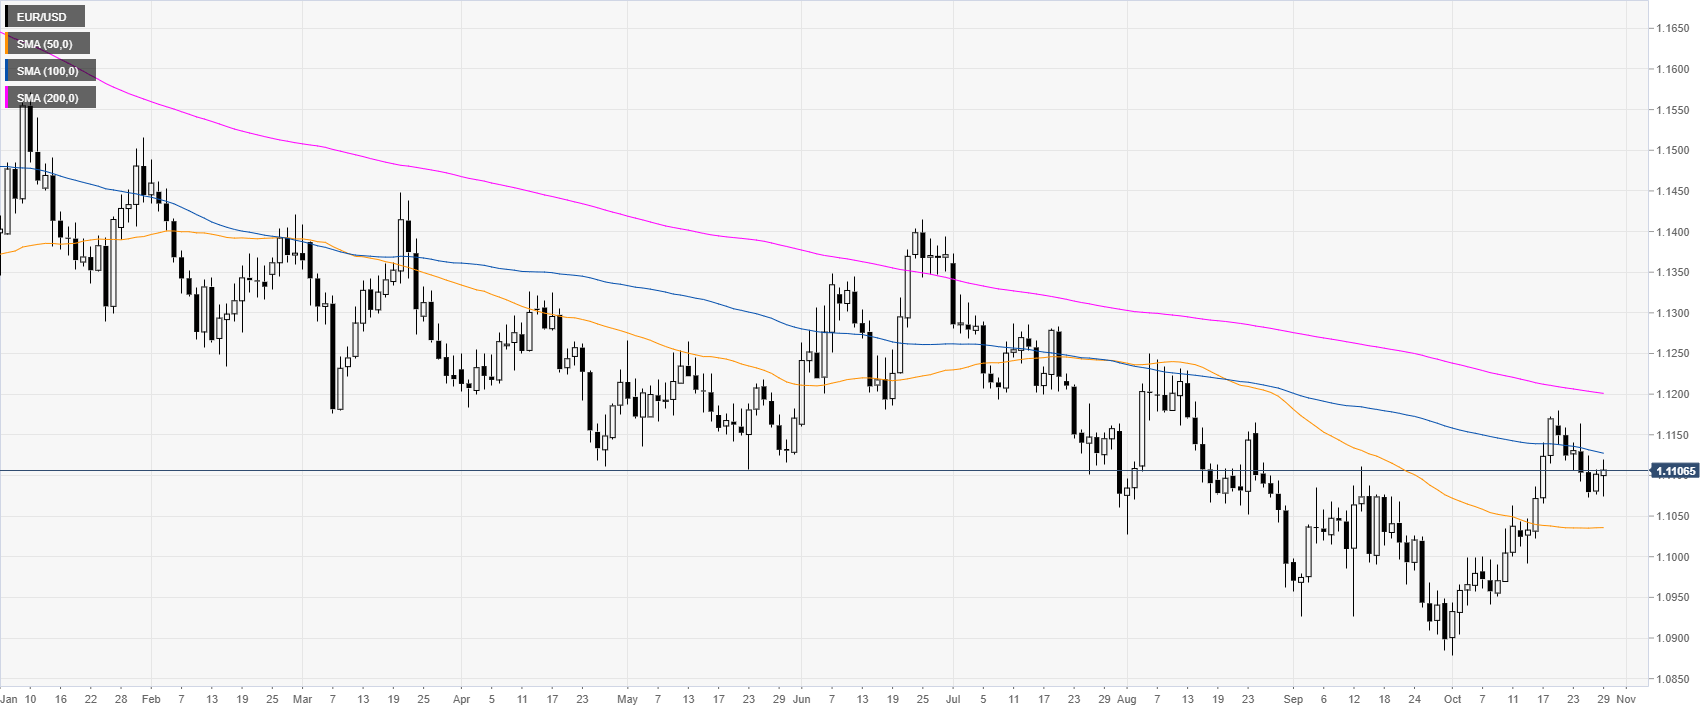
EUR/USD daily chart
On the daily chart, the Euro is trading in a bear trend below its 100 and 200-day simple moving averages (DMAs). The main macroeconomic event of the week is likely going to be the Fed Interest Rate Decision on Wednesday.
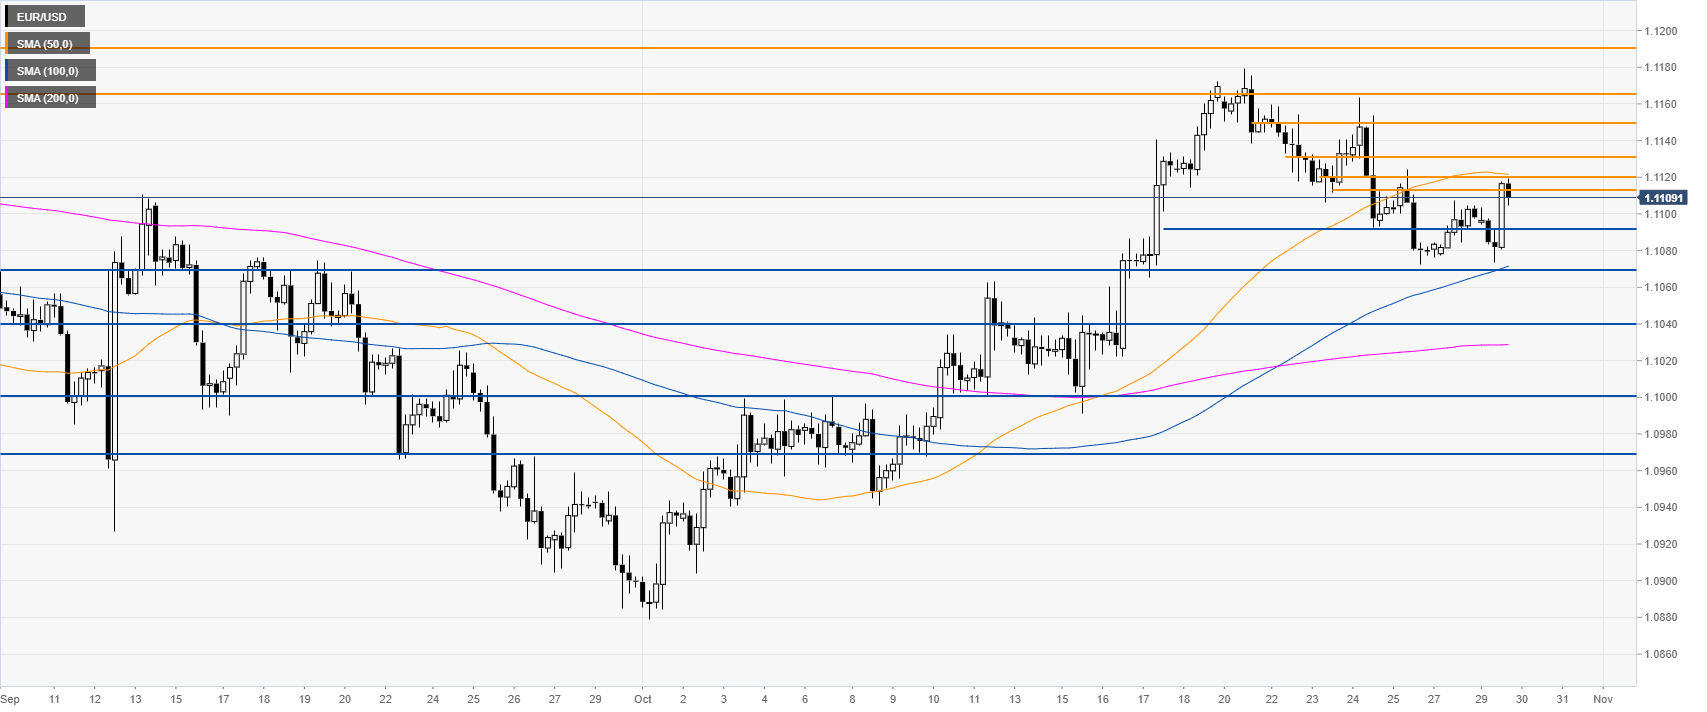
EUR/USD four-hour chart
The Fiber, on the four-hour chart, is trading above its 100 and 200 SMAs. This Tuesday, the spot challenged the 1.1113/20 resistance zone and the 50 SMA. A daily close above the mentioned resistance zone is needed to generate further strength towards 1.1135/50 and 1.1165 resistance levels, according to the Technical Confluences Indicator.
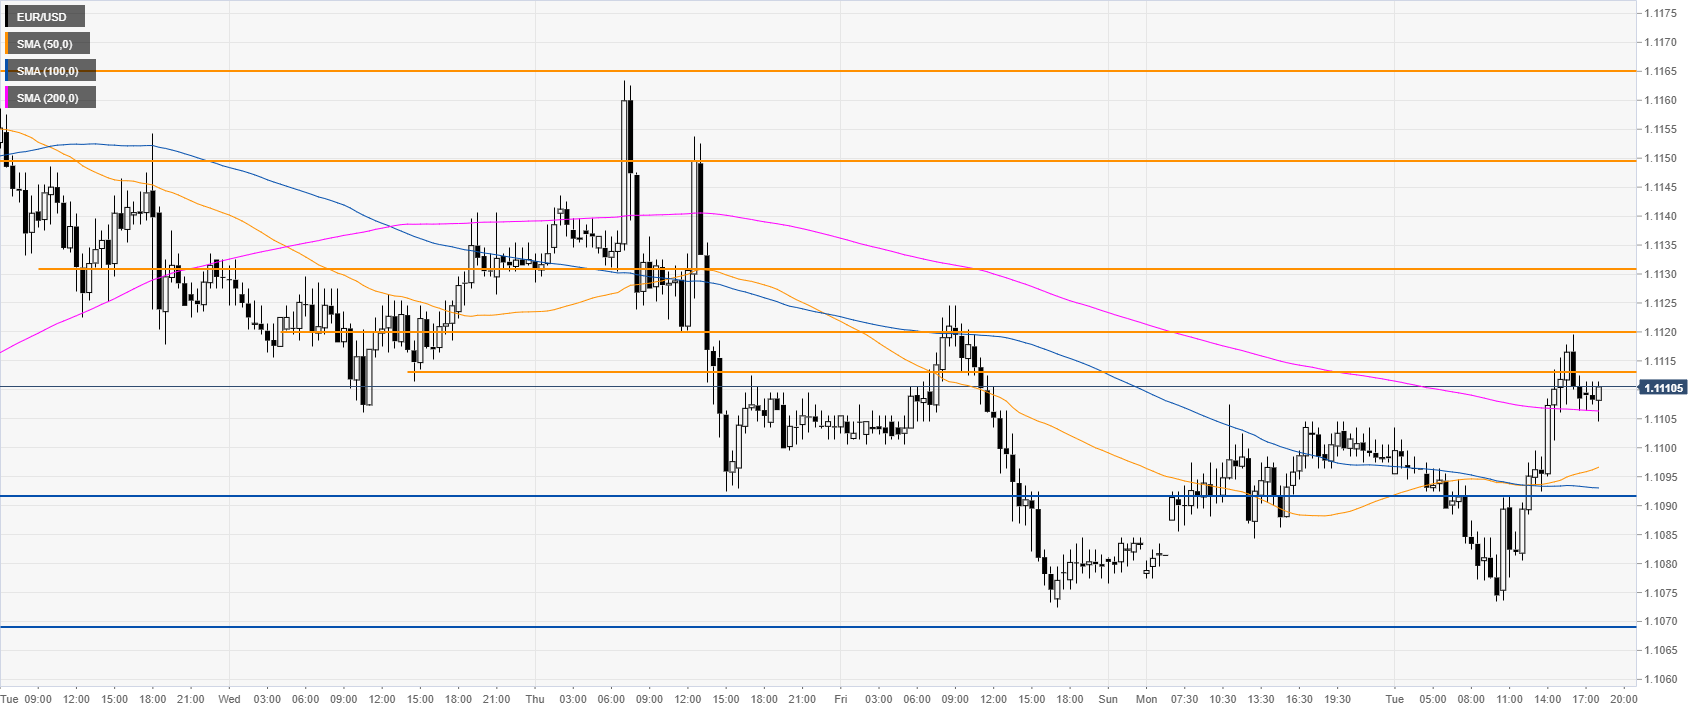
EUR/USD 30-minute chart
The exchange rate is trading above its main SMAs on the 30-minute chart, suggesting a bullish bias in the near term. The level to beat for bulls is the 1.1120 resistance. If broken, 1.1165 can become an important target on the way up. Support is seen at 1.1092 and 1.1069 price levels.
Additional key levels