Back
18 Sep 2019
AUD/USD technical analysis: Aussie drops after hawkish Fed cut
- AUD/USD breaks through the 0.6827 support after the hawkish rate cut.
- The level to beat for sellers is the 0.6800 handle.
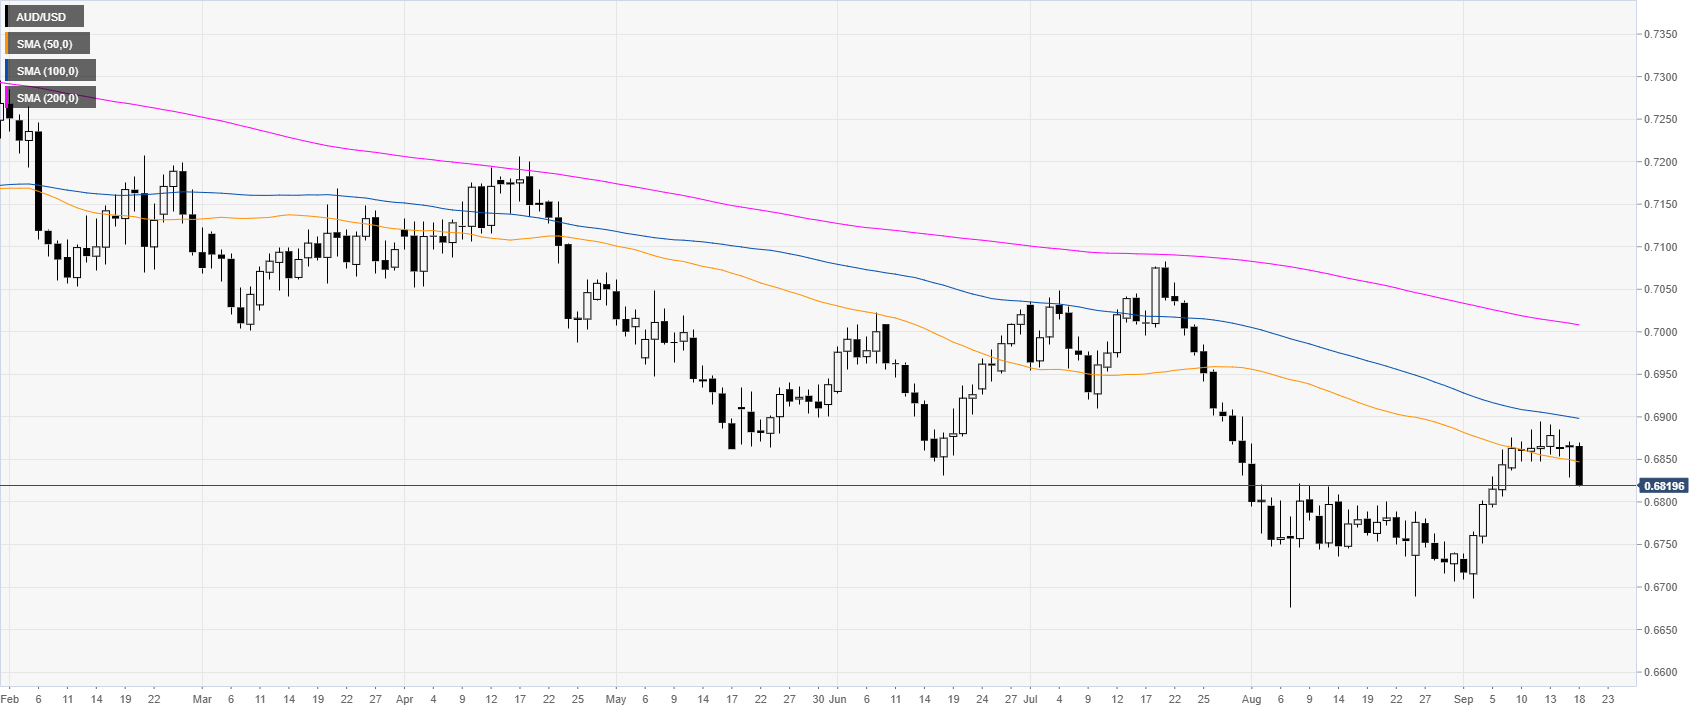
AUD/USD daily chart
The Aussie is trading in a bear trend below the main daily simple moving averages (SMAs). As expected, the Federal Reserve Bank cut interest rates by 25 bps.
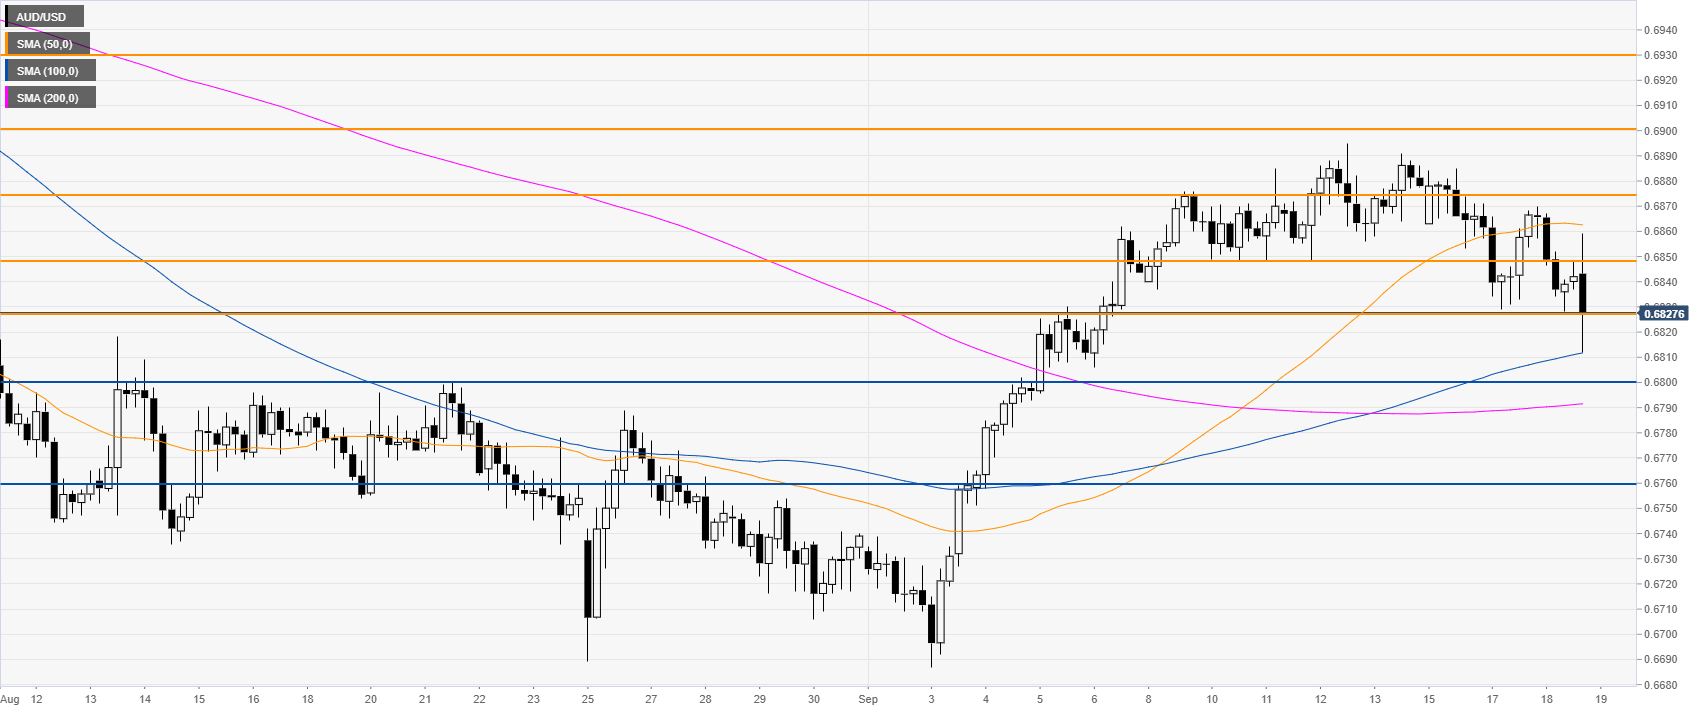
AUD/USD 4-hour chart
The market is breaking down below the 0.6827 support as the spot is testing the 100 SMA. Bears want to drive the market towards the 0.6800 figure and potentially towards 0.6760, according to the Technical Confluences Indicator. The 0.6827 level is now resistance. Further up 0.6848 can also act as resistance.
Additional key levels