Oil Technical Analysis: Black Gold bears driving the market towards $50.00 a barrel
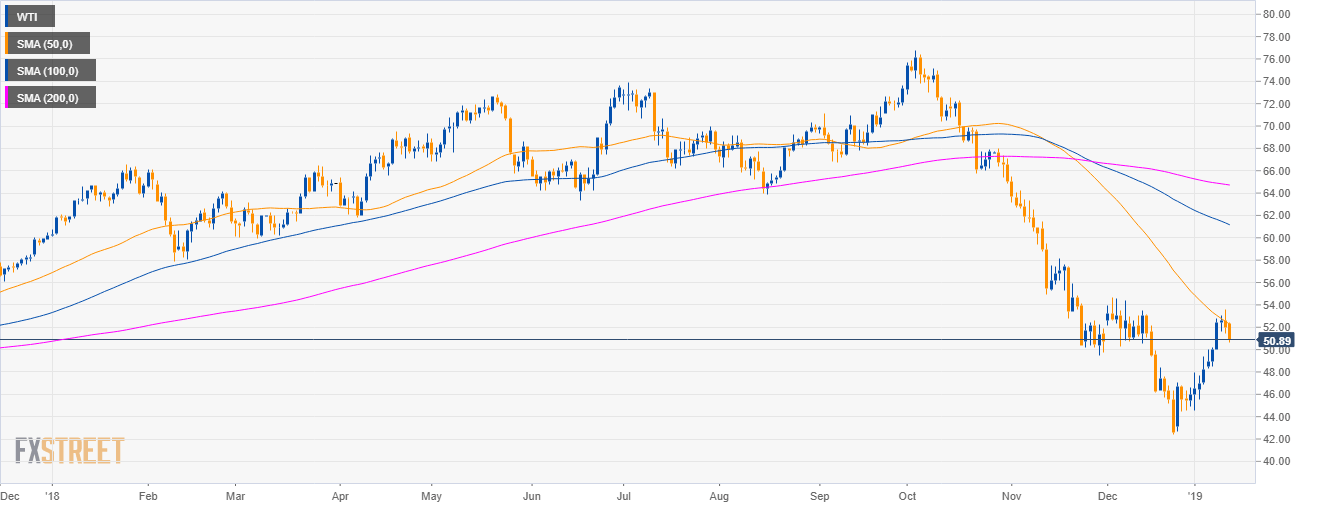
Oil daily chart
- WTI oil is trading in a bear trend below the 50, 100 and 200-period simple moving average (SMA).
- Oil rejected $54.00 a barrel along with the 50 SMA.
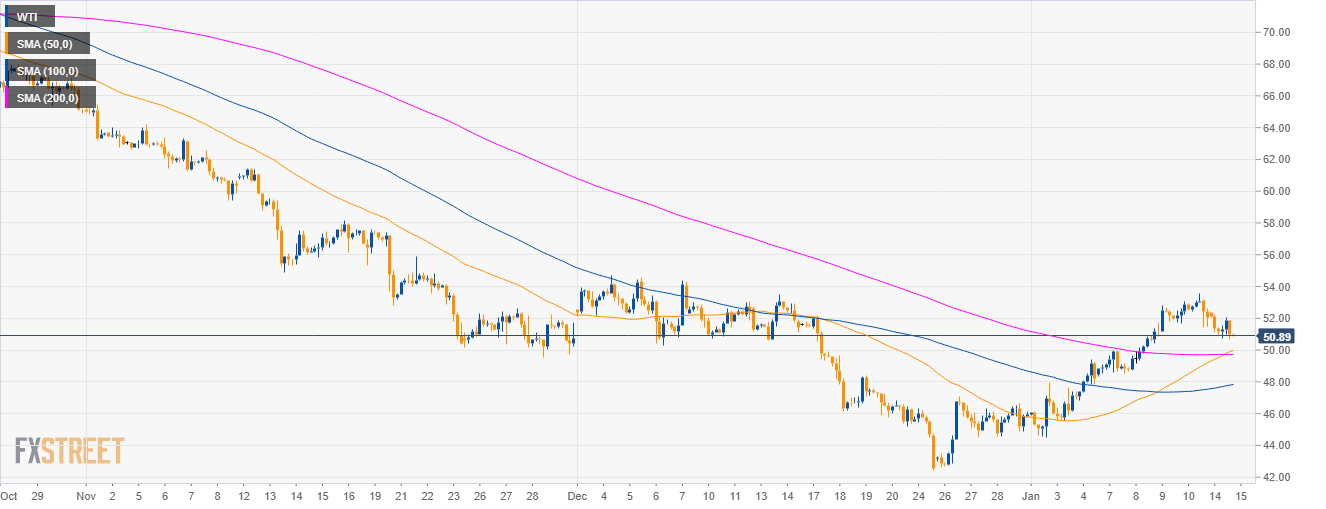
Oil 4-hour chart
- The market is trading above the 50, 100 and 200 SMA.
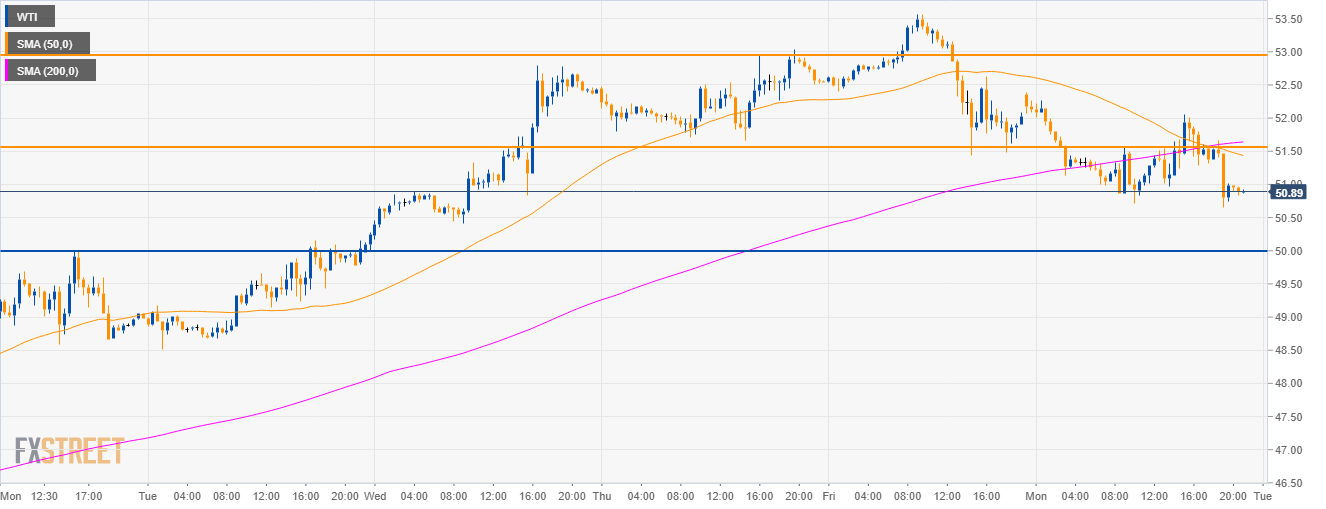
Oil 30-minute chart
- Oil broke below its 200 SMA as traders are testing the 51.00 figure.
- Bears next objective is to reach the 50.00 figure.
Additional key levels
WTI
Overview:
Today Last Price: 50.89
Today Daily change: -1.1e+2 pips
Today Daily change %: -2.06%
Today Daily Open: 51.96
Trends:
Previous Daily SMA20: 48.12
Previous Daily SMA50: 51.5
Previous Daily SMA100: 60.54
Previous Daily SMA200: 64.59
Levels:
Previous Daily High: 51.96
Previous Daily Low: 51.96
Previous Weekly High: 53.57
Previous Weekly Low: 48.33
Previous Monthly High: 54.68
Previous Monthly Low: 42.45
Previous Daily Fibonacci 38.2%: 51.96
Previous Daily Fibonacci 61.8%: 51.96
Previous Daily Pivot Point S1: 51.96
Previous Daily Pivot Point S2: 51.96
Previous Daily Pivot Point S3: 51.96
Previous Daily Pivot Point R1: 51.96
Previous Daily Pivot Point R2: 51.96
Previous Daily Pivot Point R3: 51.96