Back
13 Jul 2018
Crude Oil WTI Technical Analysis: Bull correction might be over
- Crude oil rose above 71.19 May 23 low then dropped about $1 to now trade below $71.00 a barrel.
- The bull breakout attempt above 71.00 was met with quite strong selling pressure.
- If bulls are not quick in resuming the up move, the bears might take over again and try to drive the market below the 70.00 figure next week.
Crude oil WTI 15-minute chart
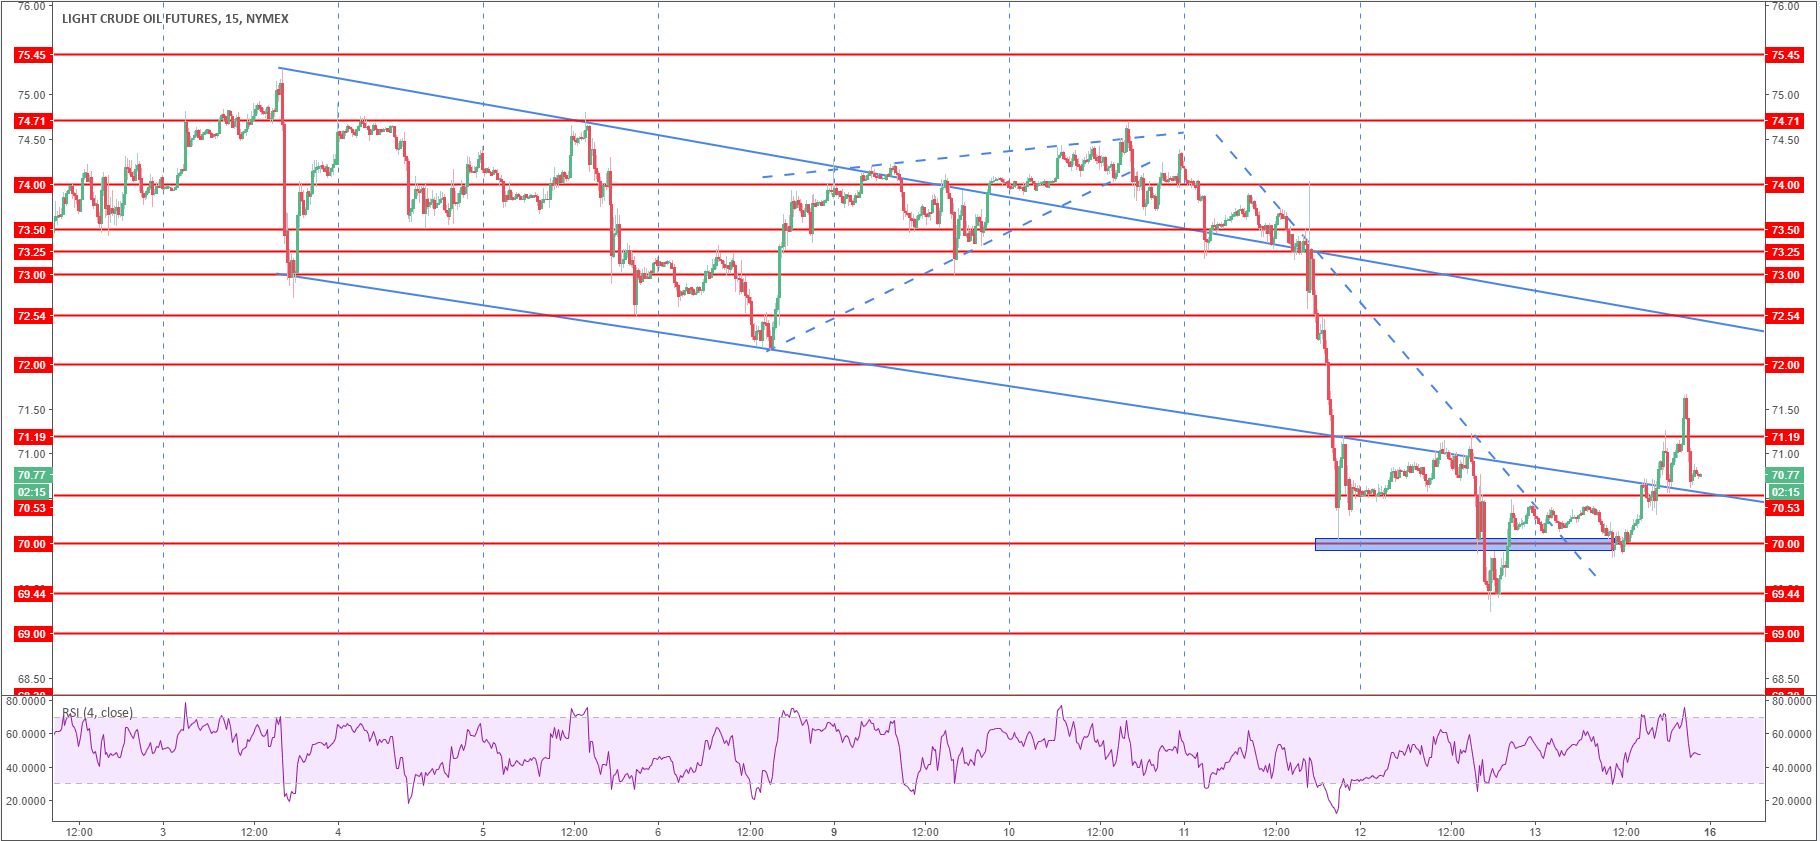
Spot rate: 70.66
Relative change: 0.67%
High: 71.20
Low: 69.21
Trend: Bearish
Resistance 1: 71.19 May 23 low
Resistance 2: 72.25 last week’s low
Resistance 3: 72.83 June 27 swing high
Resistance 4: 72.53 July 5 low
Resistance 5: 73.00 figure
Support 1: 70.53 May 24 low
Support 2: 70.00 figure
Support 3: 69.44 June 25 high
Support 4: 69.00 figure
Support 5: 68.30 demand level