NZD/USD Price Analysis: Hovers above the psychological support of 0.6100
- NZD/USD could test the psychological support of 0.6100 on Thursday.
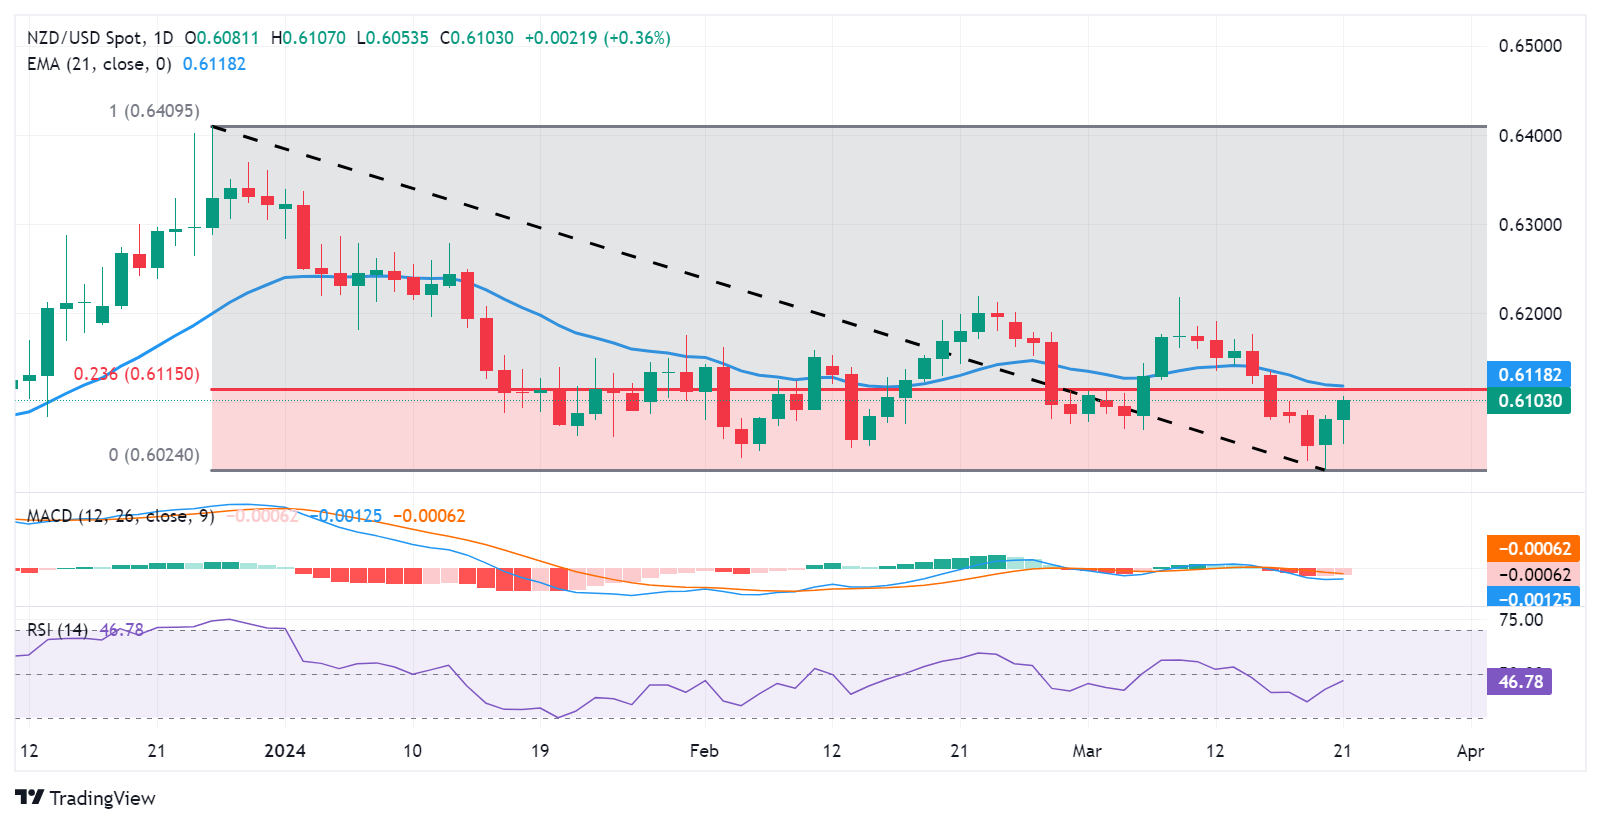
- Technical analysis indicates a bearish momentum for the pair.
- The area around the 23.6% Fibonacci retracement level and the 21-day EMA could act as a resistance zone.
NZD/USD continues to gain ground for the second consecutive day, which could be attributed to the dovish remarks by the Federal Reserve. The pair trades above the psychological support of 0.6100 during the early European session on Thursday.
A decisive move below this level could exert downward pressure on the NZD/USD pair to navigate the area around the major support of 0.6050.
A break below the latter could lead the NZD/USD pair to revisit March’s low at 0.6024, followed by the psychological support at 0.6000. Traders will closely monitor these levels for potential shifts in market sentiment.
According to the Moving Average Convergence Divergence (MACD) analysis, a prevailing downward sentiment is indicated for the NZD/USD pair. This is evidenced by the MACD line positioned below both the centerline and the signal line, signaling a bearish trend. Furthermore, the 14-day Relative Strength Index (RSI) is below the 50 level, providing additional confirmation of the bearish sentiment.
On the upside, the NZD/USD pair could find a key barrier lies at the 23.6% Fibonacci retracement level at 0.6115, aligned with the 21-day Exponential Moving Average (EMA) at 0.6118. The pair could face further resistance barriers if it climbs higher, with key levels anticipated at 0.6150.
NZD/USD: Daily Chart