Gold Price Forecast: XAU/USD marches towards $1,880 as US Inflation hogs limelight
- Gold price is marching towards $1,880.00 as the US Dollar Index is struggling to find support.
- The 10-year US Treasury yields have weighed down to 3.55% amid an upbeat market mood.
- The headline US CPI is seen declining to 6.7% led by lower gasoline prices.
Gold price (XAU/USD) is aiming to extend its recovery to near the critical resistance at $1,880.00 in the Asian session. The precious metal recovered sharply in the late New York session after dropping to near $1,867.50 amid its rangebound behavior ahead of the release of the United States inflation data.
S&P500 futures are displaying a subdued performance in Asia, however, the overall risk profile is significantly positive. The alpha generated by 10-year US Treasury bonds has surrendered its recovery move amid optimism, on a broader note, and has slipped to near 3.55%. Meanwhile, the US Dollar Index (DXY) has slipped further to near 102.75 as the street is expecting a further slowdown in the Consumer Price Index (CPI).
Analysts at NBF, see headline prices decreasing 0.1% MoM and the year-on-year rate should come down from 7.1% to 6.7%. The food component likely remained relatively strong, but this increase should have been more than compensated by lower gasoline prices. The Core index, meanwhile, may have continued to be supported by rising rent prices and advanced 0.3% on a monthly basis. This would translate into a two-tick decline of the 12-month rate to 5.8%.”
From a risk-on mood to an economic slowdown and lower consensus for the United States Consumer Price Index (CPI), none of the catalysts is showing signs of recovery in the US Dollar Index after the carnage. A decline in the US inflation figures might force the Federal Reserve (Fed) to revise its monetary policy projections for CY2023 and beyond.
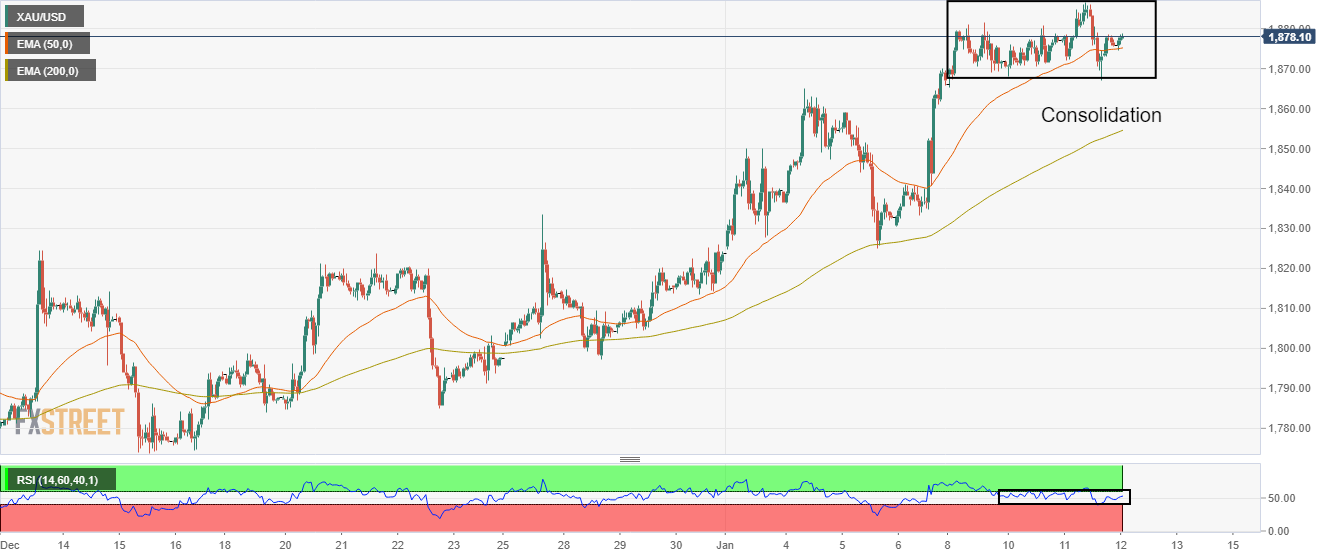
Gold technical analysis
Gold price is struggling to find direction and is oscillating in a $1,868.30-1,885.85 range from the past four trading sessions. The upside bias is still solid as the 50-and 200-period Exponential Moving Averages (EMAs) at $1,875.41 and $1,854.89 respectively are sloping north, which adds to the upside filters.
Meanwhile, the Relative Strength Index (RSI) (14) is oscillating in a 40.00-60.00 range, which indicates a consolidation ahead.
Gold hourly chart